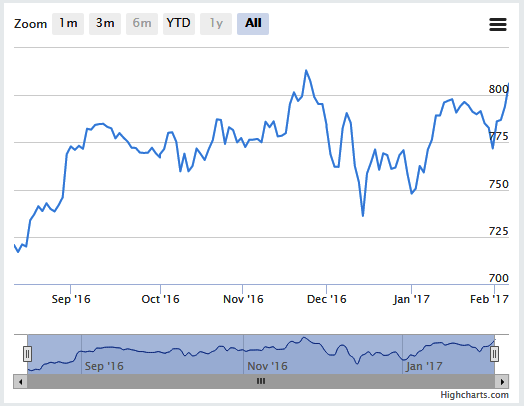
Quickly way to build beautiful chart using Yahoo Finance + Highstock

A few day ago for one project, I needed to build a financial chart using Yahoo Finance and Highstock.
As a result and as a reminder to me, I'm writing this article. I also hope that this article may be useful to my dear readers.
Below is a small piece of code that turns your data into a beautiful chart.
$(function () {

  $.ajax({
    type: 'GET',
    dataType: 'jsonp',
    cache: true,
    jsonp: false,
    jsonpCallback: 'graph', // By default the chartapi returns finance_charts_json_callback, however we overridden it to graph in our URL.
    url: 'http://chartapi.finance.yahoo.com/instrument/1.1/goog/chartdata;type=close;range=6m/json/?callback=graph',
    processData: false
  }).success(function (data) {

    var chartData = [];

    // Preparing the data for chart.
    $.each(data.series, function (i, value) {
      // Highstock expects the date in Timestamp, so use Timestamp if chartapi.finance.yahoo.com provides date in Timestamp
      // or we need convert to timestamp if chartapi.finance.yahoo.com provides date in YYYYMMDD format.
      // var chartTime = data.series[i].Timestamp;
      // var chartClose = data.series[i].close;
      var date = data.series[i].Date.toString(),
        year = date.substring(0, 4),
        month = date.substring(4, 6),
        day = date.substring(6, 8),
        chartTime = new Date(year, month, day).getTime(),
        chartClose = data.series[i].close;

      chartData.push([chartTime, chartClose]);
    });

    // Create the chart.
    $('#container').highcharts('StockChart', {
      series: [{
        data: chartData,
        tooltip: {
          valueDecimals: 2
        }
      }]
    });

  });

});
By default "Yahoo Finance API" returns JSON data wrapped in a function called finance_charts_json_callback(), for my convenience, I added ?callback=graph to URL and used it in jsonpCallback. You can rename it as you want.
$(function() {

  $.getJSON("http://chartapi.finance.yahoo.com/instrument/1.1/goog/chartdata;type=close;range=6m/json/?callback=?", function(data) {
    var labelsData = [];
    var chartData = [];

    $.each(data.series, function(i, value) {
      // Chart.js expects the date in free format, so I want to prepare date's format like YYYY-MM-DD.
      var date = data.series[i].Date.toString(),
        year = date.substring(0, 4),
        month = date.substring(4, 6),
        day = date.substring(6, 8),
        chartTime = year + '/' + month + '/' + day,
        chartClose = data.series[i].close;

      labelsData.push(chartTime);
      chartData.push(chartClose);
    });


    // Create the chart.
    var ctx = $("#container");
    var myChart = new Chart(ctx, {
      type: 'line',
      data: {
        labels: labelsData,
        datasets: [{
          label: '# of Series',
          data: chartData,
        }]
      }
    });

  });
});
In this example, I am showing how to build the similar chart using another library called Chart.js instead of Highstock. More choice is better ;-) Also as you noticed, I decided to use $.getJSON instead of $.ajax request.
Live demos: with javascript libraries and dependencies:
- Highstock: http://jsfiddle.net/mamont77/ddhbemwh/
- Chart.js: http://jsfiddle.net/mamont77/tbLar4Lv/
Also, you can more customise and theme it with official Highstock documentation or Chart.js documentation.
As you can see, to build such a chart is not difficult. And of course, you can use any other library that you like Plotly.js, D3.js, etc. The logic is the same. It is necessary to get the data, prepare data, create a graph.
Thank you for attention.
